JVM
JVM Memory Model
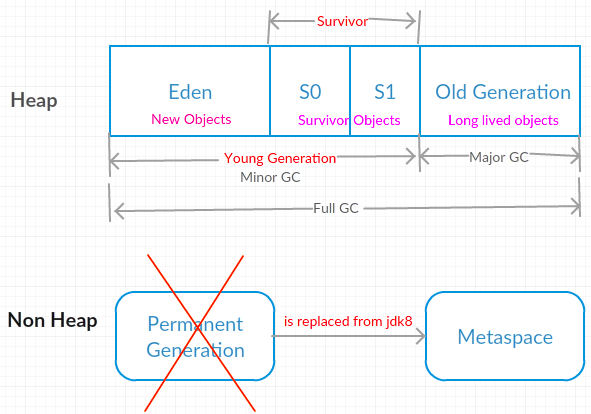
Young Generation
- It contains newly-allocated objects
- Most of the newly-created objects goes to
Eden. - When Eden space is full,
Minor GCis performed and all the survivor objects are moved to one of the survivor spaces. Minor GCalso checks the survivor objects and move them to the other survivor space. So at a time, one of the survivor space is always empty.
Old Generation
- Objects that are survived after many cycles of minor gc are moved to the Old generation
- When Old Gen space is full,
major gcis performed.
Why Heap divided into Generations
In General Applications most of the objects are short-lived. Fewer and fewer objects remain allocated over time.
That’s why to enhance the performance of the JVM, Heap is broken up into smaller parts called generations and JVM performs GC in these generations when the memory is about to fill up.
PermGen
Since PermGen is removed from jdk8, thus the PermSize and MaxPermSize JVM arguments are ignored and
a warning is issued if they present at start-up.
Metaspace
The class definitions are loaded into Metaspace.
By default metaspace is limited by the amount of available native memory.
A new flag MaxMetaspaceSize allowing you to limit the amount of native memory used for class metadata.
If you don’t specify this flag, the Metaspace will dynamically re-size depending of the application demand at runtime.
Garbage Collection
As long as an object is being referenced, the JVM considers it alive.
Once an object is no longer referenced and therefore is not reachable by the application code, the garbage collector removes it and reclaims the unused memory.
When
when JVM runs Garbage Collector, we can not expect.
Garbage Collector
- Serial
- Parallel
- CMS (Concurrent Mark Sweep)
- G1 (Garbage First)
Minor GC
Minor gc is triggered if Eden is full.
Since Young generation keeps short-lived objects, Minor GC is very fast and the application doesn’t get affected by this.
Major GC
Major GC takes a long time because it checks all the live objects.
Major GC should be minimized because it will make your application unresponsive for the garbage collection duration.
The duration taken by garbage collector depends on the strategy used for garbage collection.
Full GC
Full GC is cleaning the entire Heap – both Young and Old generation.
Monitor
We can use the Java command line as well as UI tools for monitoring garbage collection activities of an application.
jstat
JDK built-in tool.
jvisualvm
JDK built-in tool.
Just run jvisualvm command in the terminal to launch the Java VisualVM application.
Once launched, you need to install Visual GC plugin from Tools –> Plugins option