OutOfMemory Java Heap Space
Java Heap Space
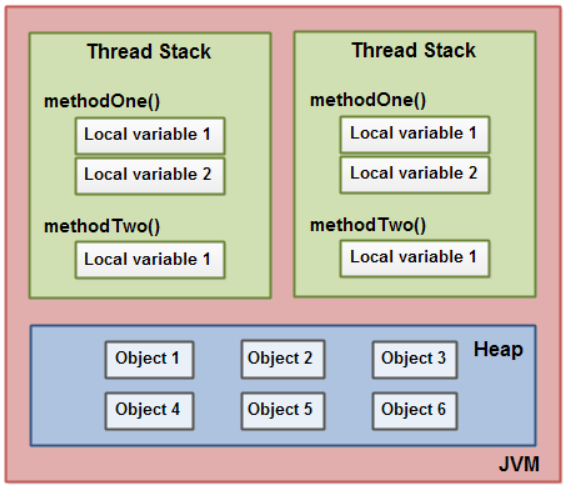
From the diagram above, we can see that the heap is used to allocate memory to Objects and JRE classes.
The heap is created when the JVM starts up and may increase or decrease in size while the application runs.
Heap Size
Java applications are only allowed to use a limited amount of memory.
Heap size is set during the JVM launch and can be modified by specifying JVM parameters -Xmx.
For example, in setenv.bat of tomcat,
set CATALINA_OPTS=-Xms1024M -Xmx1024M
If you do not explicitly set the sizes, platform-specific defaults will be used.
OutOfMemory - Java Heap Space
When the heap becomes full, garbage is collected.
During the garbage collection objects that are no longer used/referenced are cleared, thus making space for new objects.
Hence, if JVM cannot allocate an object because heap is out of memory, and no more memory could be made available by the garbage collector, then OutOfMemory is thrown.
Reasons
There are two main reasons to get this error:
-
poor programming cause memory leak - infinite loop, not clearing memory by closing resources etc
-
low heap size - java is running on less memory than required
Memory Leak
From daemonthreads:
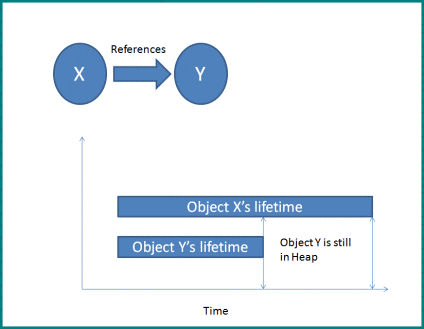
Garbage collection ( GC) is the process to remove unreferenced objects from the heap memory. However GC may not always give you 100% results. There might be some unused objects which GC cannot remove because some other object is still holding a reference to it. This concept is called as Memory Leak.
We can see in the below image that object X is holding the reference of object Y. Object Y has completed its task but cannot be garbage collected because of the unwanted reference.
How to solve
-
increase the heap size
-
find the root cause to memory leak in your programme and solve it
In most cases, #2 is what we should do. If there is memory leak in your code, only increase heap size cannot eliminate this error.
In order to find the memory leak in code, we need to :
-
Get the heap dump info
-
Analysise the heap dump
Get the heap dum info
manually collect
jmap is a JDK built in tool which can be used to create heap dump file by using the following command:
jmap -heap:live,format=b,file=/home/test.bin <pid>
<pid> is the process id of java.
It’s quite important to pass live option. If this option is passed, then only live objects in the memory are
written into the heap dump file.
If this option is not passed, all the objects, even the ones which are ready to be garbage collected are printed in the heap dump file. It will increase the heap dump file size significantly as well as analysis tedious.
automatic collect
Alternatively, you can add -XX:+HeapDumpOnOutOfMemoryError -XX:HeapDumpPath=D:\heapdump.bin to tomcat CATALINA_OPTS config,
such that tomcat will create heap dump file when it encounters OutOfMemory error.
Analysise the heap dump
The heap dump file can be parsed by jvisualvm(which is jdk built in tool) or
eclipse memory analysis(it is available as a stand-alone application or as a plugin for Eclipse).
Eclipse Memory Analysis Tool
The MAT looks like next:
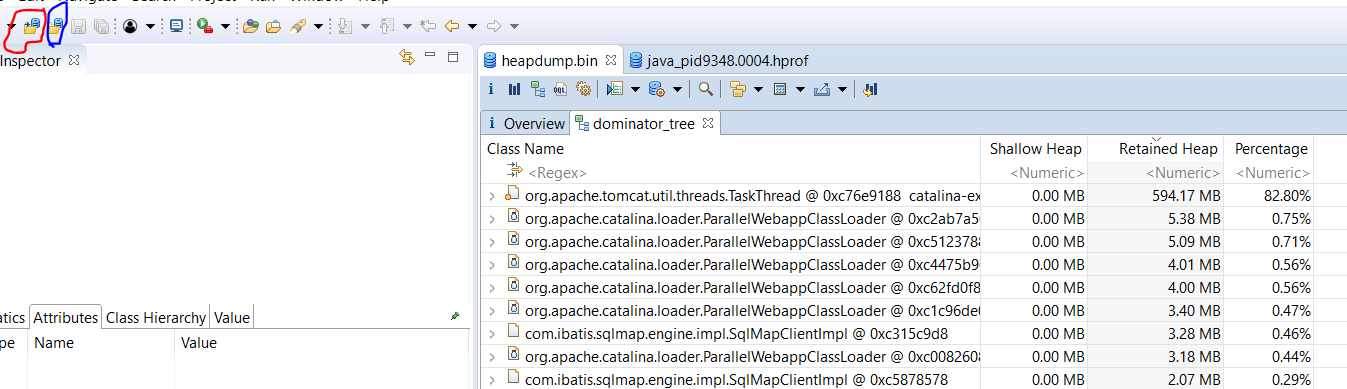
The top left button with circled by red pen is:Accquire heap dump from a locally running vm, its next button is:open heap dump
Shallow vs Retained Heap
From daemonthreads:
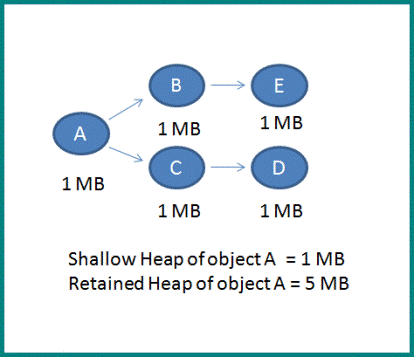
Shallow heap is the memory consumed by one object. This object might be referencing to other objects in the heap memory. Retained heap is sum of memory of this object’s and all other referenced objects.
Any object X might be consuming small memory by itself but referencing too many other unused objects. If this object is alive, garbage collector will not be able to free these unused objects from memory. In this case object X becomes important to be garbage collected because it is keeping a large set of retained heap. User should find and debug the objects where shallow heap is low and retained heap is high.
Dominator tree
There is a OutOfMemory error - java heap space thrown, and its heap dump info looks like:
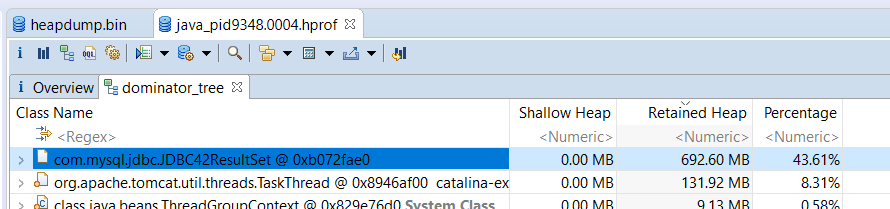
From the above screenshot, we can see that the biggest value of retained heap is about the jdbcresult, so the memory leak is caused by a sql query.
Right click this entry -> List Objects -> with outgoing references, we can see that:
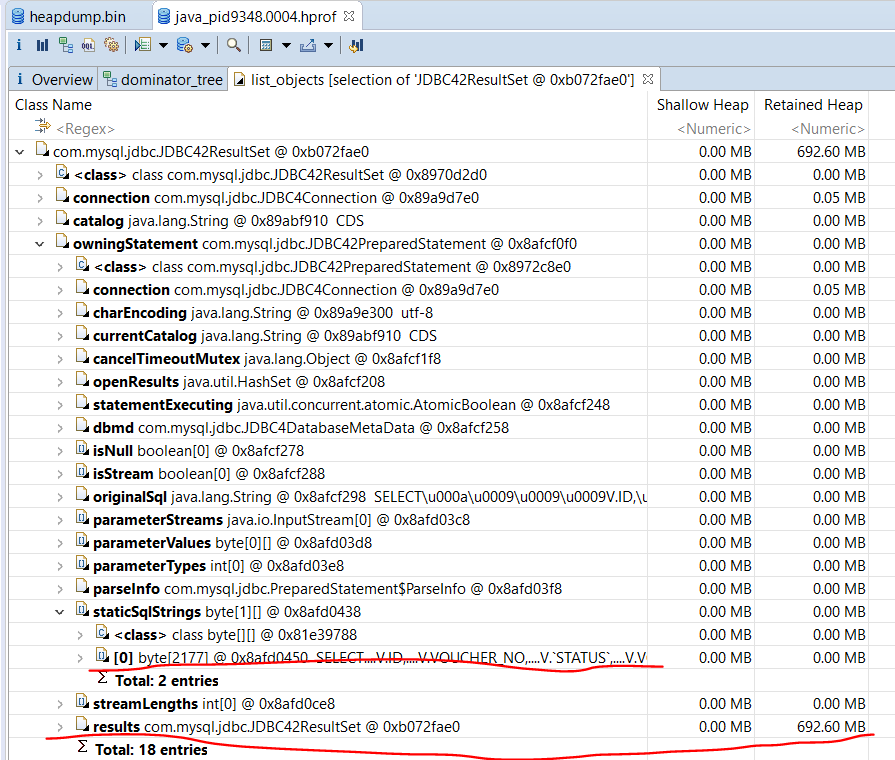
The above screen shot tells us that this sql query has too many results, as a consequence, it cause the OutOfMemory error.
It also shows this sql statement under the staticSqlStrings.
After modify this sql query, the OutOfMemory error disappear.
Leak Suspects
MAT also provides leak suspect page:
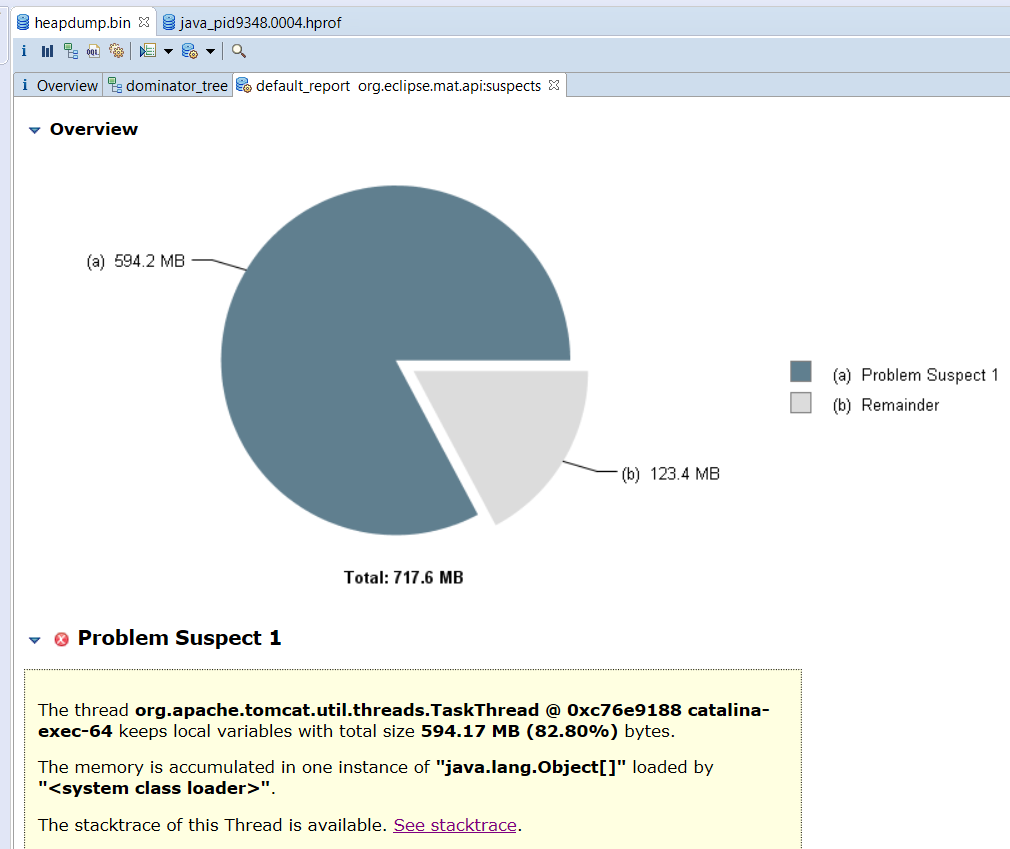
By clicking See stacktrace, we can see that:
  catalina-exec-64
  at java.lang.OutOfMemoryError.<init>()V (OutOfMemoryError.java:48)
  at java.util.Arrays.copyOf([Ljava/lang/Object;I)[Ljava/lang/Object; (Arrays.java:3181)
  at java.util.ArrayList.grow(I)V (ArrayList.java:265)
  at java.util.ArrayList.ensureExplicitCapacity(I)V (ArrayList.java:239)
  at java.util.ArrayList.ensureCapacityInternal(I)V (ArrayList.java:231)
  at java.util.ArrayList.add(Ljava/lang/Object;)Z (ArrayList.java:462)
  at com.talentkey.cds.fin.web.VoucherDailyTransctionAction.queryVoucherDetailInfo()Ljava/lang/String; (VoucherDailyTransctionAction.java:718)
It shows us that where is code cause memory leak.